CXAIR 2019.1
The CXAIR 2019.1 release builds on the usability enhancements present in the previous release by further promoting well-used reporting options and adding features that assist in report creation and administration.
Installation Prerequisites
Default Ports required: 6453/6454
Please note that these can be configured to any ports required after installation
Prerequisite software required: Java Development Kit 12 or above
Please note that due to Oracle licencing changes, an Oracle licence must be purchased to continue to use Oracle JDK in a commercial environment. More information can be found on the Oracle website: https://www.oracle.com/technetwork/java/javase/overview/faqs-jsp-136696.html
A recommended alternative to Oracle's JDK is to use the 'Open Java Development Kit' General-Availability Release 12 or above, which is available from https://openjdk.java.net. This is fully compatible with CXAIR.
When changing Java versions, there are necessary CXAIR configuration files that must be updated. Please refer to the Upgrade Procedure chapter for more information.
Please ensure that any custom External Host Name, External Port Number and External SSL Port Number System Settings values are backed-up prior to the upgrade, as they may need to be re-entered following an upgrade under certain circumstances.
Enhancements & New Features
Query
Report Searching
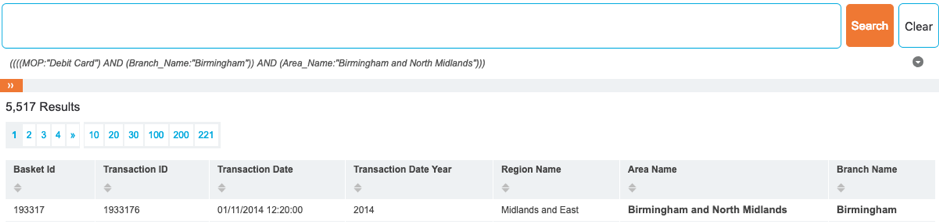
It is now possible to load reports directly from the Query bar. Simply start typing the name of the report and click the desired report from the results that appear.
Activate the Enable Report Searching option from the Query section of the User Preferences to activate this feature.

Voice Searching
Voice control can now be used to load reports and add search terms to a query when using the Google Chrome web browser.
Activate the Enable Voice Searching option from the Query section of the User Preferences to enable this feature.

Click the microphone icon in the Query bar and enable the relevant browser permissions to get started. Use the ‘Load <report name>’ and ‘Search <search term>’ syntax to perform the relevant action.
Column Headings
Extra calculations can now be displayed for numeric values in the Query screen when a column heading is clicked.
Activate the Show Extra Calculations On Headers option from the Query section of the User Preferences to enable this feature.

Additional calculations are now displayed when clicking the column heading for a numeric field, including minimum, maximum, average and sum.
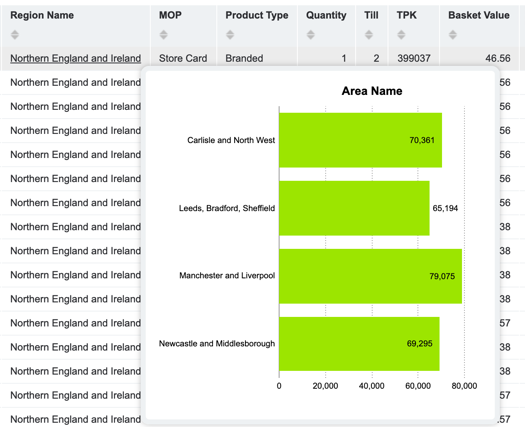
Hierarchical Charting Popups
Using the Hierarchy options for an Index, fields can be related to enhance the ad hoc functionality in the Query screen for end-users by presenting pre-defined charts for specific fields.
This functionality is set at Index level under the Hierarchy heading, where the Set Hierarchy drop-down list is used to specify the field order and the chart type can be selected:
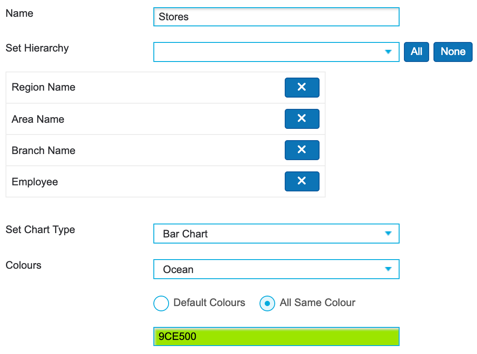
Once configured and enabled in the User Preferences, hovering the cursor over a specified field in the Query screen will draw the selected chart in a popup window:
Crosstabs
Crosstabs have been a key CXAIR reporting component since the product was first launched and as the product has matured, many new features have been added that extend this reporting capability.
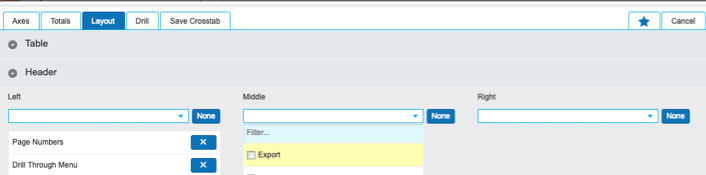
Layout Enhancements
In this release the layout has been enhanced to better integrate key features used regularly in reporting, resulting in changes that help expedite the creation process.

Levels now can be hidden directly from the Axes tab for each specified row or column using the Display icon, and headers can also be renamed for each field by clicking the … icon and using the Label option.
Clicking the Cog icon for rows and columns will present the following consolidated options:

The Do Not Indent Row Headings option has also been added to alter the display of the reporting output.
Enhanced Report Preview
The report preview that is rendered at the bottom of the screen has also been enhanced. Rather than displaying an approximation of the report based on layout alone, the preview will now render the report based using values in the Index.
This new preview can also be used to style Crosstabs and charts by clicking the desired area and selecting from the pop-up options.


Enhanced PDF Exporting
When exporting a Crosstab to PDF format, the new Fit to Page option ensures that the output is split correctly over multiple pages. Use in conjunction with the Page Size option in the Layout tab to achieve a greater level of control over the row count.
Furthermore, enabling the new Page on Inner Row option will calculate the number of pages based on the inner values rather than on the outer values to ensure that sizing remains consistent when the report is filtered or page breaks are used in a Pages report.
Please note that the print functionality has now been deprecated. The scaling algorithms provided during a PDF export provide a far more robust output that can then be printed from a PDF reader of choice.
Filter Totals
Used in conjunction with the Filter tab for a total, it is now possible to display the grand total of only the filtered values. Enable the option in the Table section of the Layout tab once a total has been filtered.
Chart Themes
A number of new chart themes have been added to enhance presentation in reporting, available from the Colours drop-down list.
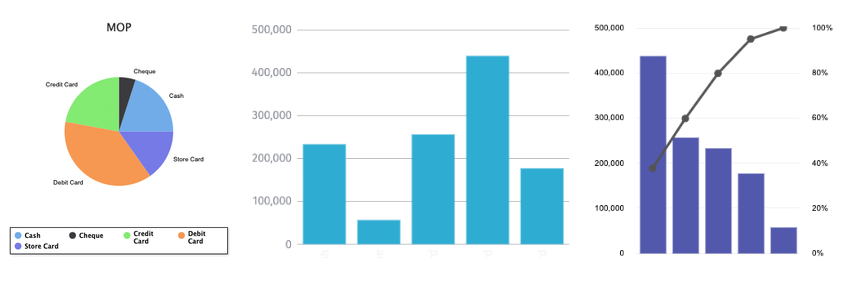
New themes include Gammel, Candy and Fusion and can be used for all chart types.
New Mathematical Functions
The mathematical functions available in the calculation builder have been expanded to now include Fact, Greatest Common Denominator (GCD), Lowest Common Multiple (LCM), Log, Mod, Power, Quotient and Sign for greater flexibility when performing calculations.
Report Rendering Optimisation
Designed to be used in conjunction with the Do Not Indent Row Headings option, the new Do Not Aggregate Records option reduces the render time by not aggregating values in the output.
This new option in located the Table section of the Layout tab and is especially useful when using the Crosstab functionality to output grouped and nested row headings rather than values.
Conditional Formatting
The conditional formatting functionality has now been extended to support chart values. Simply select Chart from the Scope drop-down list to apply this new feature:

Pages
When Pages was first introduced, it represented a radically different way of creating reports without the restrictions of ‘traditional’ analytics tools. In the 2017.2 release, the interface was overhauled to utilise the higher resolutions that had become available along with streamlining the entire report creation process.
In this release, the interface has again been enhanced and features added to hone the usability and add to the power of the tool.
Layout Enhancements
A single Report Style option consolidates frequently used options and adds new features:

Header and Footer Options
It is now possible to add traditional headers and footers to reports, such as a company logo or strap-line, that will repeat for every page.
Click Report Style in edit mode and enable the Show Header & Footer option to activate this feature. Then, simply add the desired information to the header and footer components that will automatically be added to each page.
Auto Refresh
Pages reports can now be set to automatically refresh to account for new data when in Run mode. Simply click the page in the structure panel and click Page Style to reveal the Auto Refresh option. Enter the required refresh rate, in seconds, and click Apply to save.
Containers
A new Pages reporting component has been added. Containers allow multiple report components to be added to a single Tile, controlled via a single transition:

Load All Pages
When scrolling through a complex Pages report, there may be a slight pause while the system loads the reporting components for each page.
A new feature has been added to combat this delay and can be enabled for any Pages report. Click Report Style in edit mode and enable the Load All Pages option to activate this feature.

Now when the report is run, all reporting components are loaded rather than the system waiting for navigation to a certain page. Please note this may incur a small loading time to initially display the report.
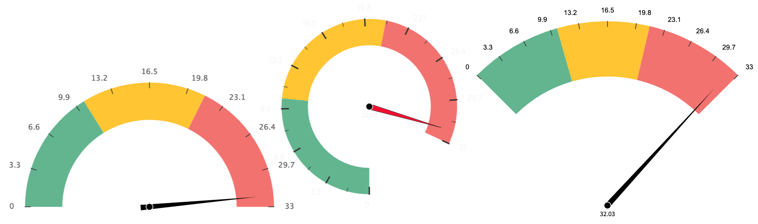
New Gauges
The gauge selection has been updated to include a number of new additions to provide end-users with eye-catching totals in a report:
Fill Page
A new layout option has been added that automatically sizes a reporting component to fill the entire page. Simply click the added component and click the Fill Page option from the floating toolbox.

This is especially useful when adding a background image to a report and can also be used for any reporting component.
Zoom Slider
When in Run mode, a zoom slider has been added to the bottom of the screen to control the report zoom, previously only available in edit mode. The setting is saved for each user per report, resulting in reports that always fill the required screen size and resolution.
Exporting Individual Components
Within a Pages report, it is now possible for end users to export individual components of interest. Within the Layout tab of an added gauge, chart or Crosstab, the new Export option can be added to either the Header or Footer of the component:
When the Pages report is run, users can then export a component of interest by clicking the associated export icon:
Updated Third-Party Text Editor
The third-party text editor has been upgraded, providing greater stability and adding a range of new features, such as in-built image editing tools:

Other features include the ability to add text tables and extended functionality for adding fields, filters and totals from an Index.
HTML Component Management
Using the Text component, adding custom HTML elements using the <Source Code> option is an excellent way to enrich reports with component backgrounds and navigation buttons.
These custom text components can now be saved and imported into other reports. Click the added HTML element and click Save in the toolbox before selecting the desired folder where the component will be saved.
The Custom component can now be added to a report:

Adding this component will present a load popup where saved HTML elements can be loaded, proving access to a library of shared HTML components to enrich reports with this extra level of detail.
Component Toolbox View
The component toolbox can now be displayed as a single horizontal row to make better use of screen real-estate while creating a report. Simply click the collapse icon at the top-left of the toolbox to toggle this feature.

Legacy Report Conversion
An option to convert legacy Flow Reports to Pages has been added that will convert the entire report to the newer platform.
Simply click the cog icon for any Flow Report in the load screen and select Convert to Pages to open the report in Pages edit mode, complete with all previously configured reporting components.

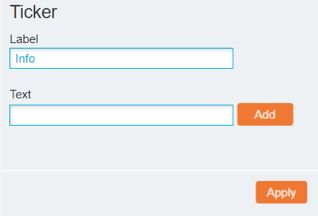
Within the Report Style options, the newly added Ticker entries permit compatibility with Flow Reports that used this feature previously.
Load Screen
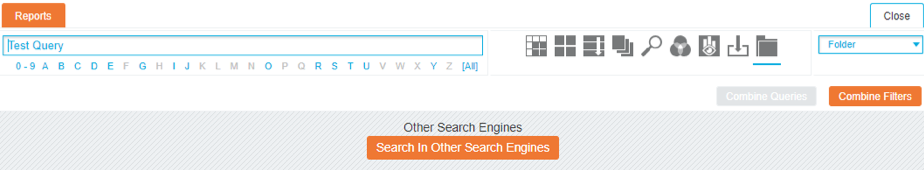
Improved Load Screen Searching
When searching for a report, the load screen will now display the option to conduct the search across a different Search Engine if no results are found.
Report Viewer
Query Bar
Administrators can now enable query bar functionality for other users when viewing row-level data, allowing report viewers to further filter down the data. The original syntax used to derive the rows is also displayed below:
Enable the Show Search Bar option in the CXAIR Viewer section of the System Settings to turn on this feature.
User Preferences
Report Viewer users now manage their own User Preferences to update their Real Name, Email and Password. This is accessed using the new Preferences icon in all areas of Report viewer.
Administration
Amalgamated Wizard Enhancements
The Amalgamated Index Wizard screen has been refreshed to enhance usability and to better represent the process on-screen.
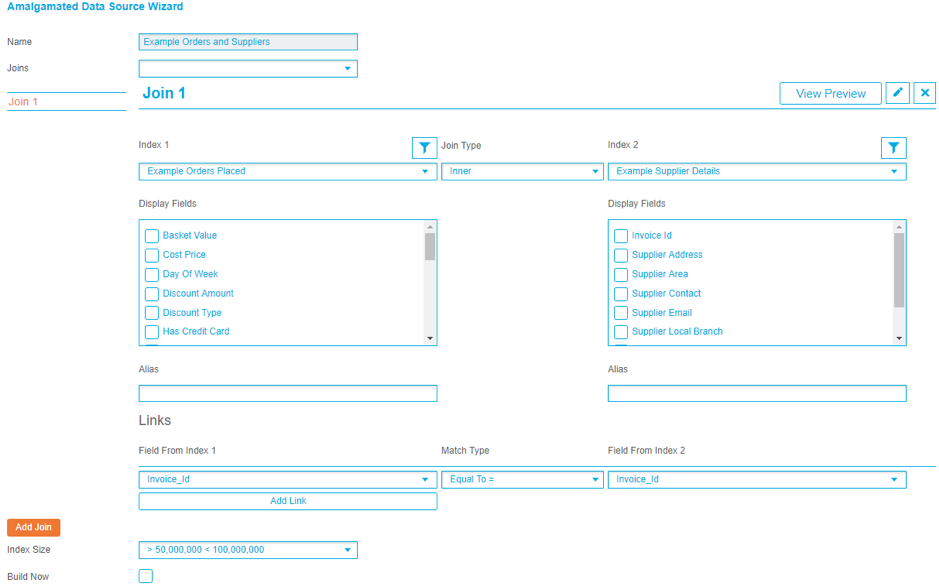
Field selection has been improved to improve speed of selection and visibility, while the View Preview button can be used to display a breakdown of the current configuration. Click the filter icon for each Index to add saved Queries.
Copying Schedules
Index Schedules can now be copied to quickly queue builds with similar configurations. Click the Copy icon for the required entry in the Index Schedules screen to use this feature.
Auto Refresh
The Refresh / Filter button functionality has now been extended to automatically refresh the screen when the Auto Refresh checkbox is enabled. This is especially useful when monitoring Index builds and negates the previous requirement to manually refresh the screen.
Audit Index Enhancements
A number of enhancements have been made to the contents of the CXAIR Audit Index to improve usability and make report creation a more straightforward process.
These changes are supplemented with a new Audit Reporting Guide that has been written to detail the key steps needed to create a number of reports using the newly organised fields.
Crosstab Index Creation
Crosstab Indexes have become an integral part of reporting in instances where aggregated values must be referenced and in the latest release and the steps needed to create this output have now been simplified into a single screen.
Simply select Crosstab from the Type drop-down list in the Data Sources screen and load the required Crosstab to configure the source values.
Index Optimisation
When Indexes are created on the system, the process used to determine the number of fields that are added to the Display Fields Excluded list has been optimised to facilitate higher-specification servers. This results in less fields automatically added to the list unnecessarily.
Fusion Maps
Changes to the Google Maps API mean that there is now a stricter limit on the number of map loads across an organisation. More information is available on the Google developer website: https://developers.google.com/maps/documentation/
Due to these changes, over 1,500 Fusion Maps have now been fully implemented into the latest CXAIR release. These offline maps provide unlimited map loading and, in many cases, an improved visual output.

Configuration is handled at Index level and can be added by opening the Maps section. Select Fusion Maps from the Map drop-down list and select the required region from the Map Type drop-down list. Select the required field from the Code drop-down list and click Data Mapping to open the configuration options.
Values from the Index must then be mapped to the matching location. Use the Value drop-down list to select the value that matches the entry in the corresponding Map Area and click Save Map to save the configuration.

Point-to-point Distance Calculation
The load restrictions also apply to the Google Drivetime API. A new Distance option is now available in the Extra Fields Data Source Group options to replicate this functionality and build the required values into the Index.

Select Distance from the Additional Index Fields section and specify the two Longitude and Latitude values. Select the distance unit from the Radius radio buttons and click Save to complete the process. Once rebuilt, an extra column denoting the distance from the specified fields will be available.
Extended Back-up Options
Within the System tab of the System Settings screen, new options have been added to extend the automated back-up functionality to also include empty Index structures and reports.

Select a time period from the relevant area to schedule the back-up procedure, which will execute automatically.
Log Retention
It is now possible to specify, in days, the length of time that the system log files will be retained using the Log Retention option in the System tab of the System Settings.
CXForms Indexes
A new option has been added to stop CXForms Indexes building automatically with every new submission. Disable the Index CXFORMS on Demand option to apply this setting.
Documentation
Following the move to online documentation in the 2017.2 release, the CXWiki platform has been expanded to include a number of additional guides to assist with report creation.
The Reporting Guides chapter has been written to include step-by-step report creation guides that utilise the latest reporting features for the 2019.1 release.