03e. Pages
Pages allows you to quickly create interactive, reporting dashboards for executive reporting packs.
Pages’ intuitive drag & drop interface allows you to quickly build interactive dashboard reports that align with your organisation’s priorities. Pages allows you to combine CX Air’s reporting features with dynamic charts and gauges, displaying data from across your organisations’ CX Air indexes, giving “at-a-glance” visibility of only the most important information and make your organisation’s often complex data easily understandable.
Plus, because Pages is integrated directly with CX Air, it gives you and Pages report users access to CX Air’s powerful data discovery and analytics capabilities, as well as its robust data & user security features.
Get Started with Pages
[HYPER] Structure of a Pages report >
[HYPER] Creating a Pages report >
[HYPER] Building a basic Pages report >
[HYPER] Designing your Pages report >
Accessing Pages
To access Pages:
- Log into CX Air then select Analytics from the welcome screen. This displays the indexes screen.
- Click the Pages option on the navigation bar running along the top of the screen. This opens the Pages workspace in Edit mode.
Note: To access Pages, you must have . Speak to your CX Air administrator.
[HYPER] Creating a basic Pages report >
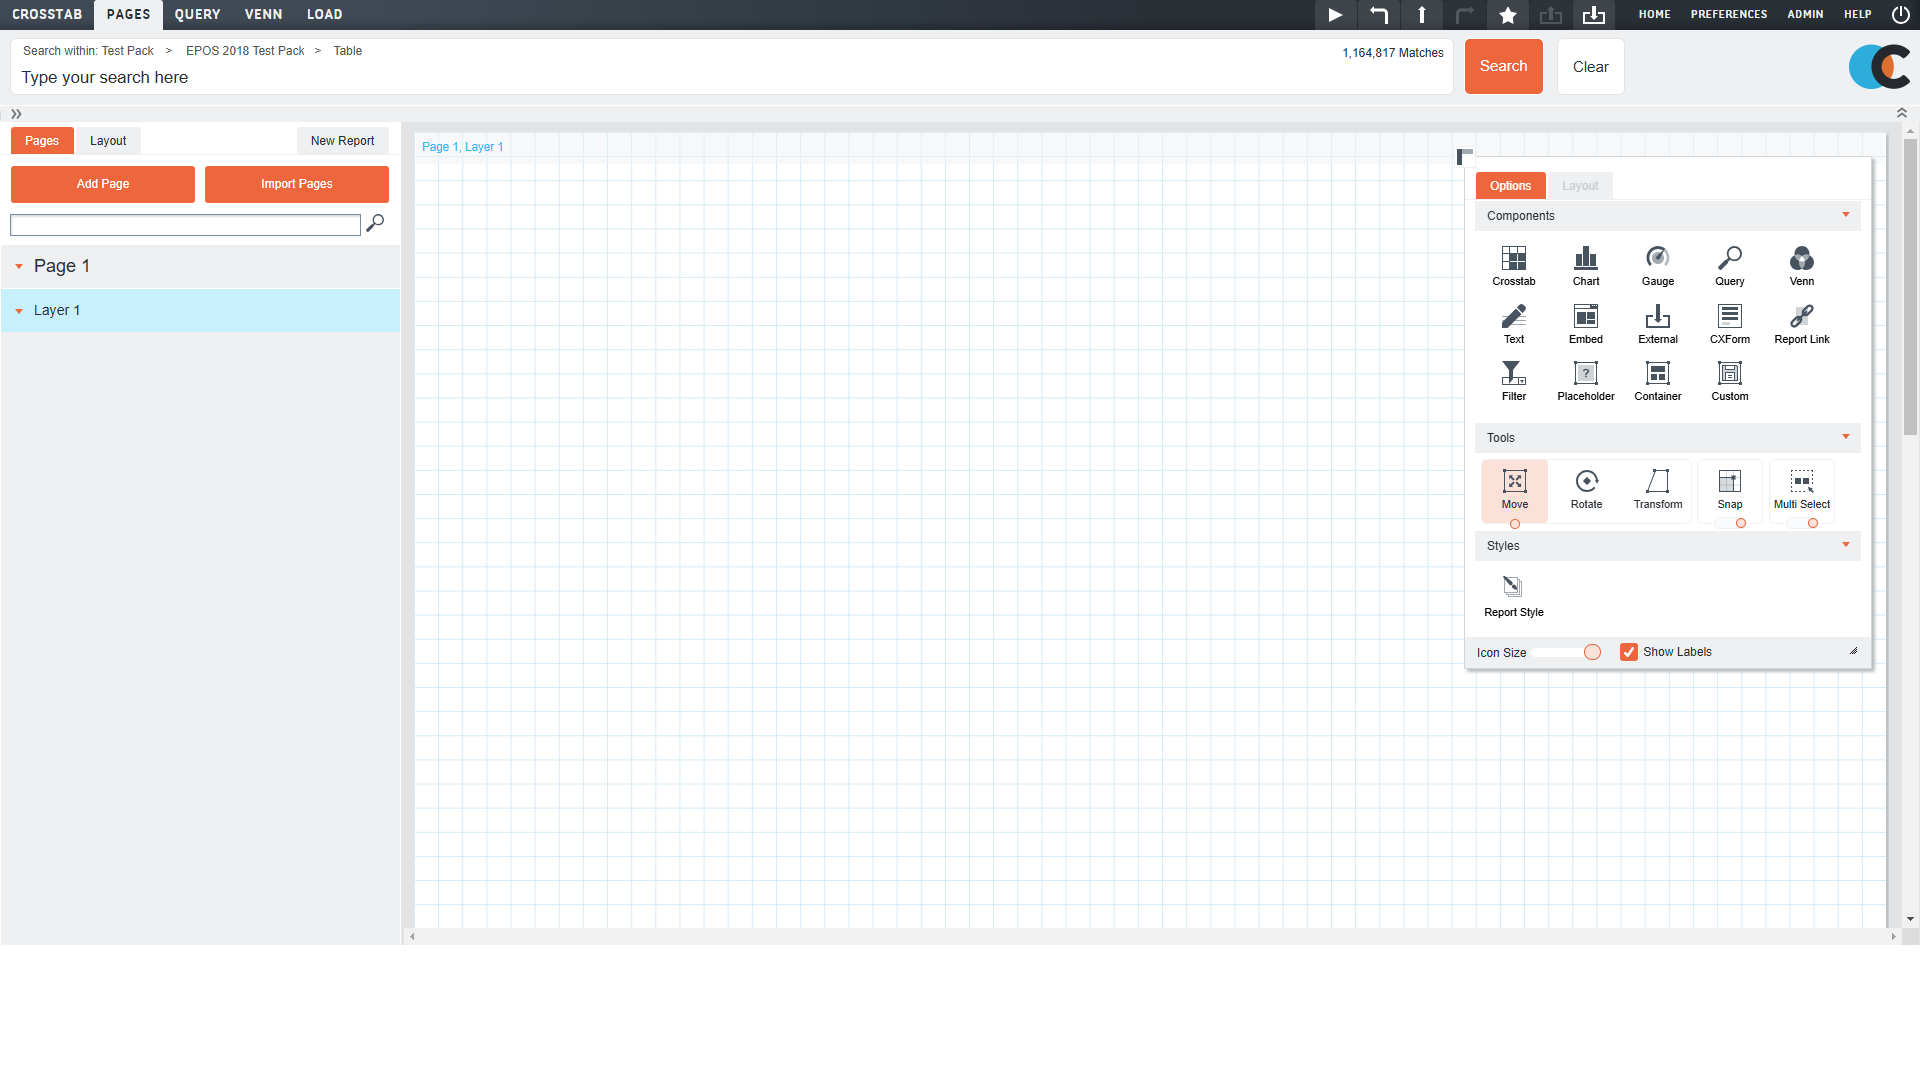
Getting to Know the Pages Edit Mode Interface
Pages’ Edit mode gives you access to the features you need to build and manage your Pages reports:
- The workspace.
- The dynamic toolbox.
- The report structure panel.
.
The Workspace
The Pages’ workspace is the large area, with the grid background, on the right-hand side of the interface.
Think of the workspace as the digital representation of a page in a physical report.
It’s here, on the workspace, that you’ll add the data reporting & styling components that make your Pages report.
The Dynamic Toolbar
The dynamic toolbar gives you access to all the reporting components (the crosstabs, charts, and gauges), the tools that give you control over the behaviour of the workspace and components, and styles options that allow you to define how the report and components look.
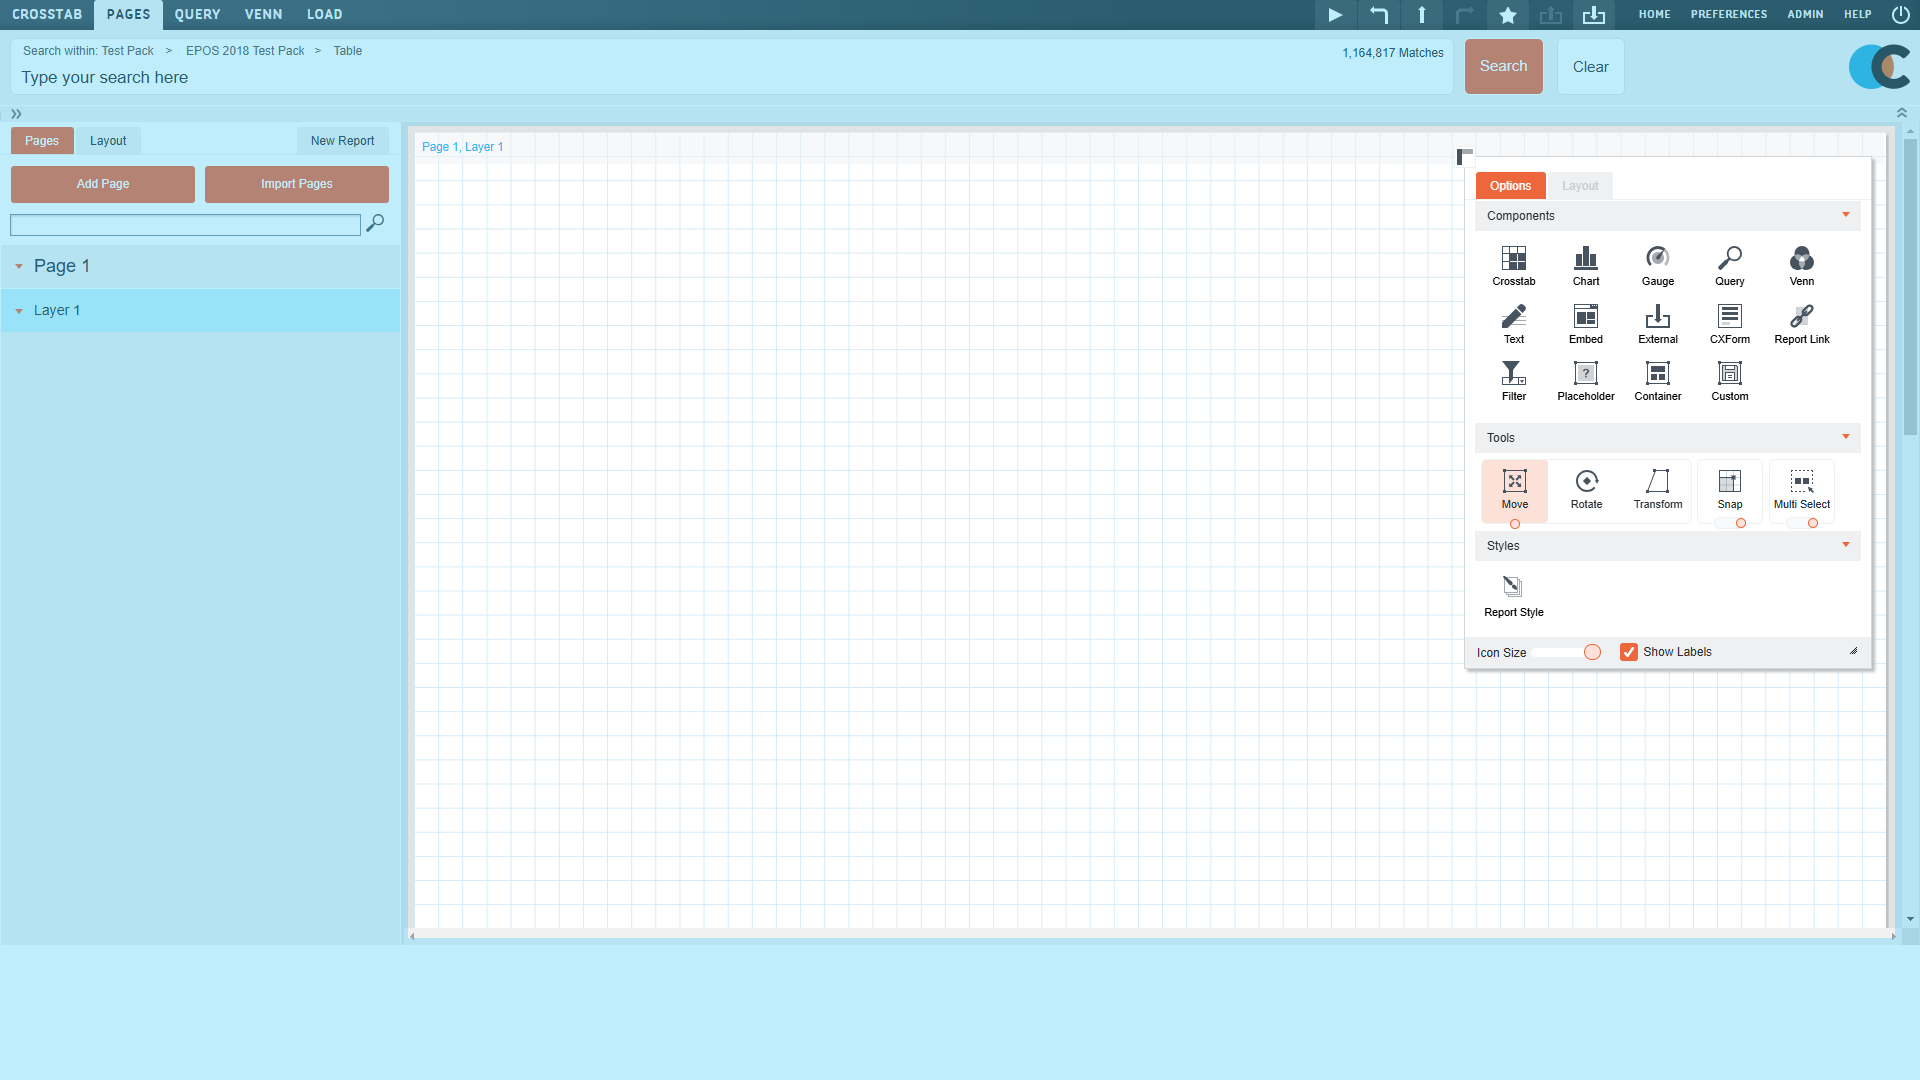
Dynamic options
The options displayed on the dynamic toolbar change depending on the currently selected context.
For example, clicking the workspace displays the components, tools and style options relevant to the workspace. Clicking a Page in the Report Structure Panel displays the components, page options and style options relevant to the selected Page. While clicking a component displays the options, layout controls and style options relevant to the selected component.
.
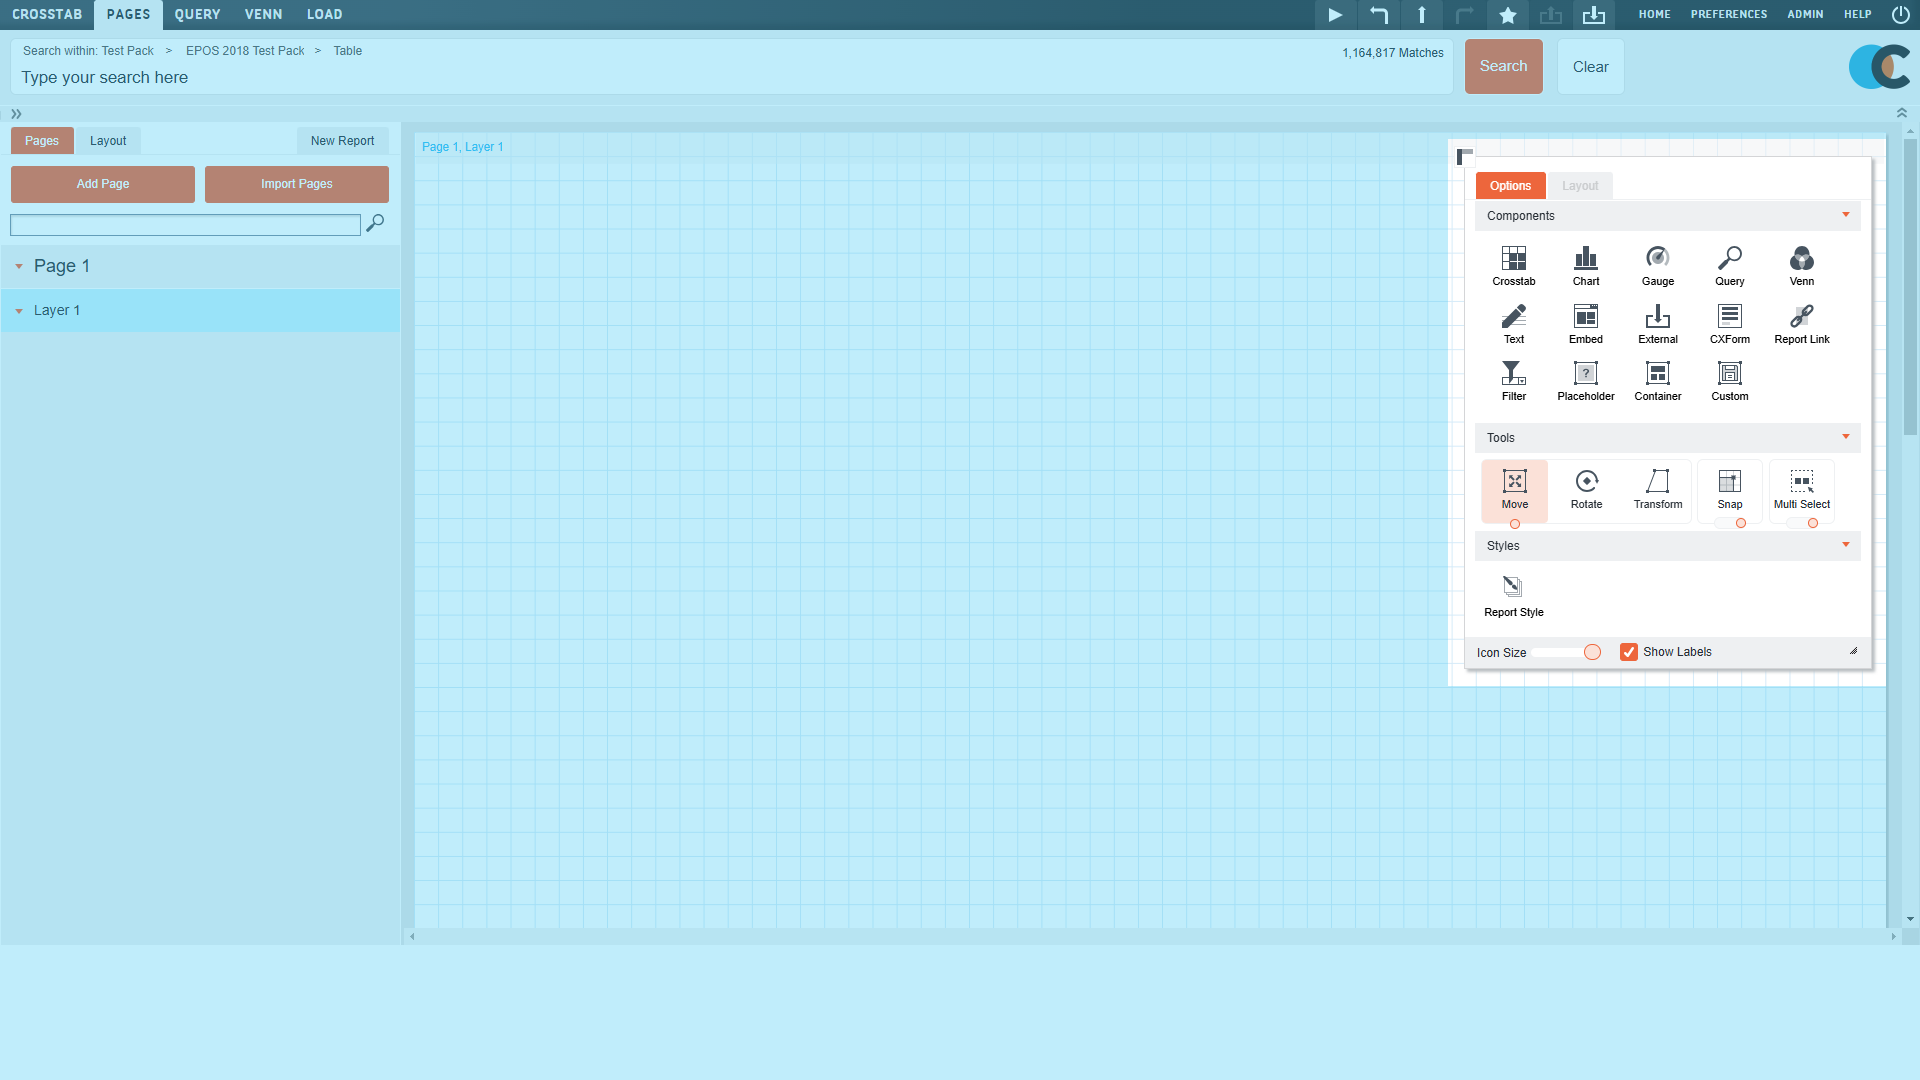
Moving & resizing the toolbar
To maximise the useable space on the workspace, you can move and resize the dynamic toolbar.
To move it around the Pages interface by clicking anywhere on the toolbar then dragging it around the workspace.
Click the toolbar toggle icon in the top-left corner to change the orientation of the dynamic toolbar from vertical to horizontal.
When the toolbar is displayed vertically, collapse the sections displayed on the toolbar by clicking the arrow on the right-hand side of the section title.
The Report Structure Panel
The Report Structure Panel on the left-hand side of the screen provides an overview of the current structure of the Pages report – its Pages, Layers, Tiles and Components – and control over the structure of the report, and its components.
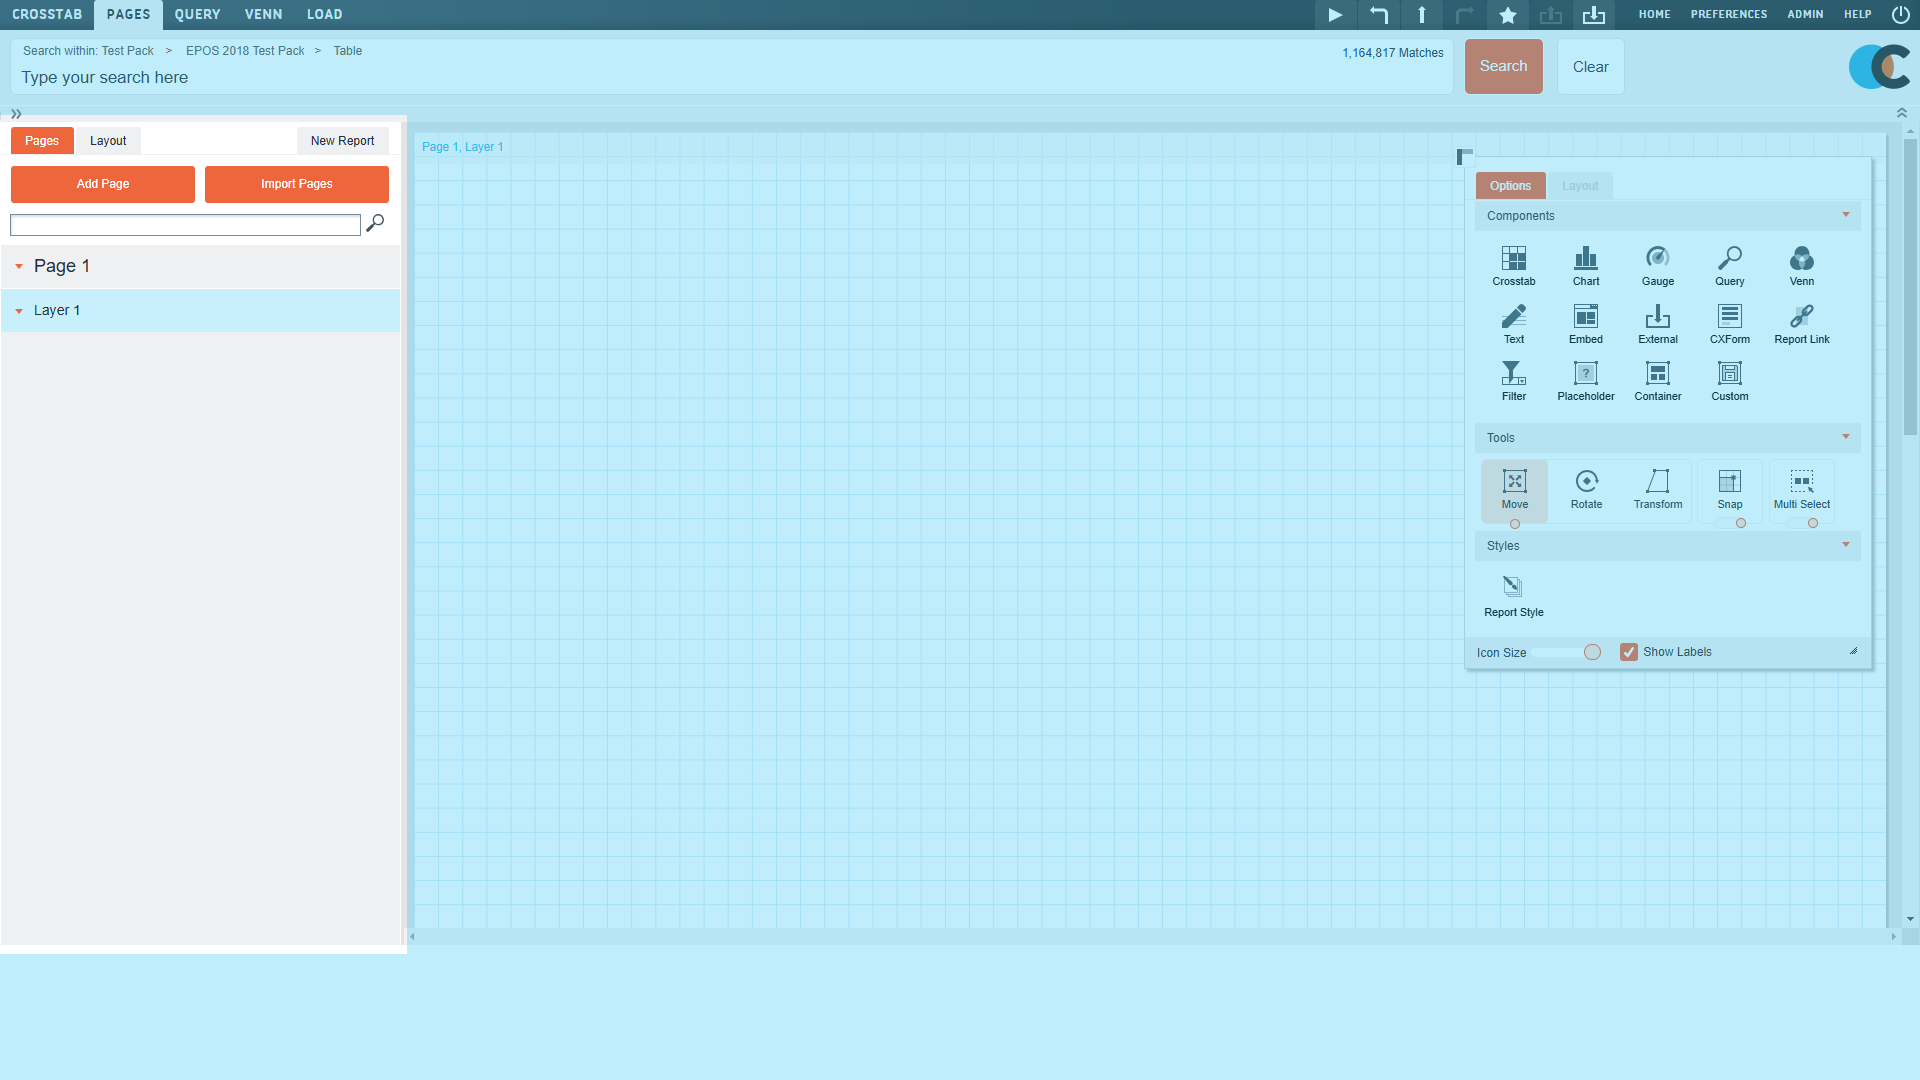
When the Pages tab is selected, you can also add new pages to the report, or import a previously selected Pages report.
When the Layout tab is selected you can review and update the structure of your Pages report.
The New Report button opens a blank Pages report – removing all previously made changes. If you have not saved these changes, they will be lost.
Note: If you have not saved your Pages report and your CX Air session times out, all of your changes will be lost. We recommend that you frequently save your Pages report.